Saving preference and households borrowing
In the fourth quarter of 2017, 40.6 percent of households prefer savings in tugrug over the other type of savings and this percent was 52.7 percent in the same quarter of 2016. On the other hand, the percentage of households who prefer savings in foreign currency has increased and reached to 22.4 percent and the percentage of households who prefer investment in immoveable assets has stayed the same compared to the same period of 2016.
Figure 14. Saving preference
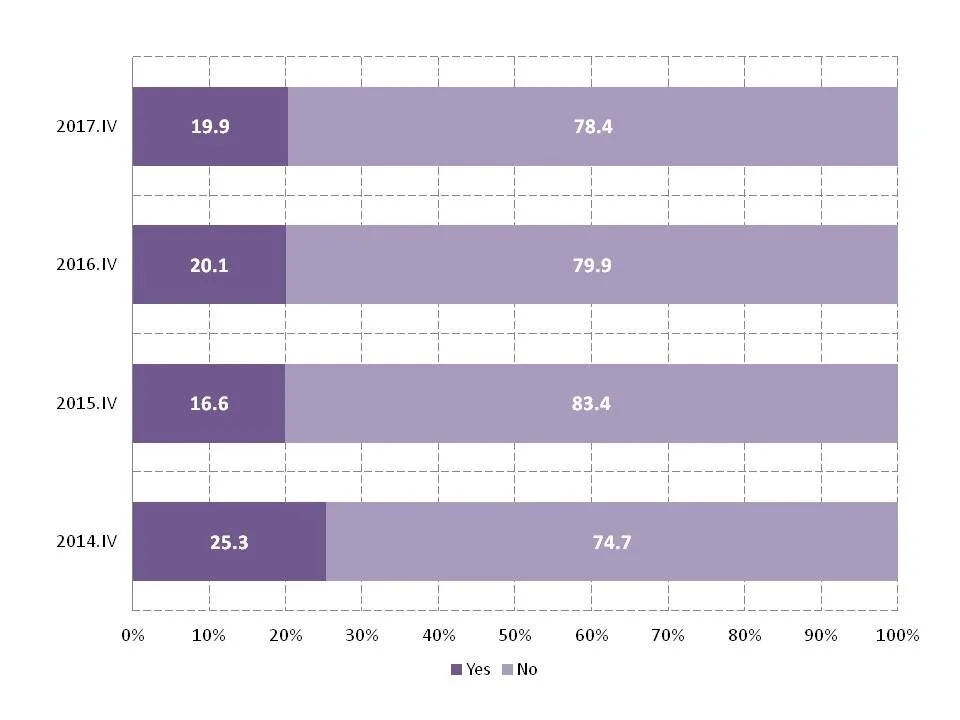
In the fourth quarter of 2017, 19.9 percent of households are planning to take loans. This is higher by 0.2 percentage points from the level in the same period of last year and higher by 3.3 percentage points from the level in 2015.
Figure 15. Plan for taking a loan


